Deploying on Konan
This section walks you through deploying your model on Konan from the portal as well as explaining the deployment process & Konan's monitoring features.
By now you should have model serving application created and containerized. In this section, we will navigate our way through Konan so you can get your model deployed.
Konan Container Registry (KCR)
In the previous section on containerization, you were asked to push the final image either to a container registry of your choice or use the container registry provided by Konan. In case you opted for the latter, go to https://app.konan.ai/KCR to get your KCR credentials.
In the bottom section, click reveal credentials to get the username and password you need for login. In a terminal, execute the commands shown and only fill in your image name and tag in place of <image>:<tag>, all other fields should be auto-filled after revealing your credentials.
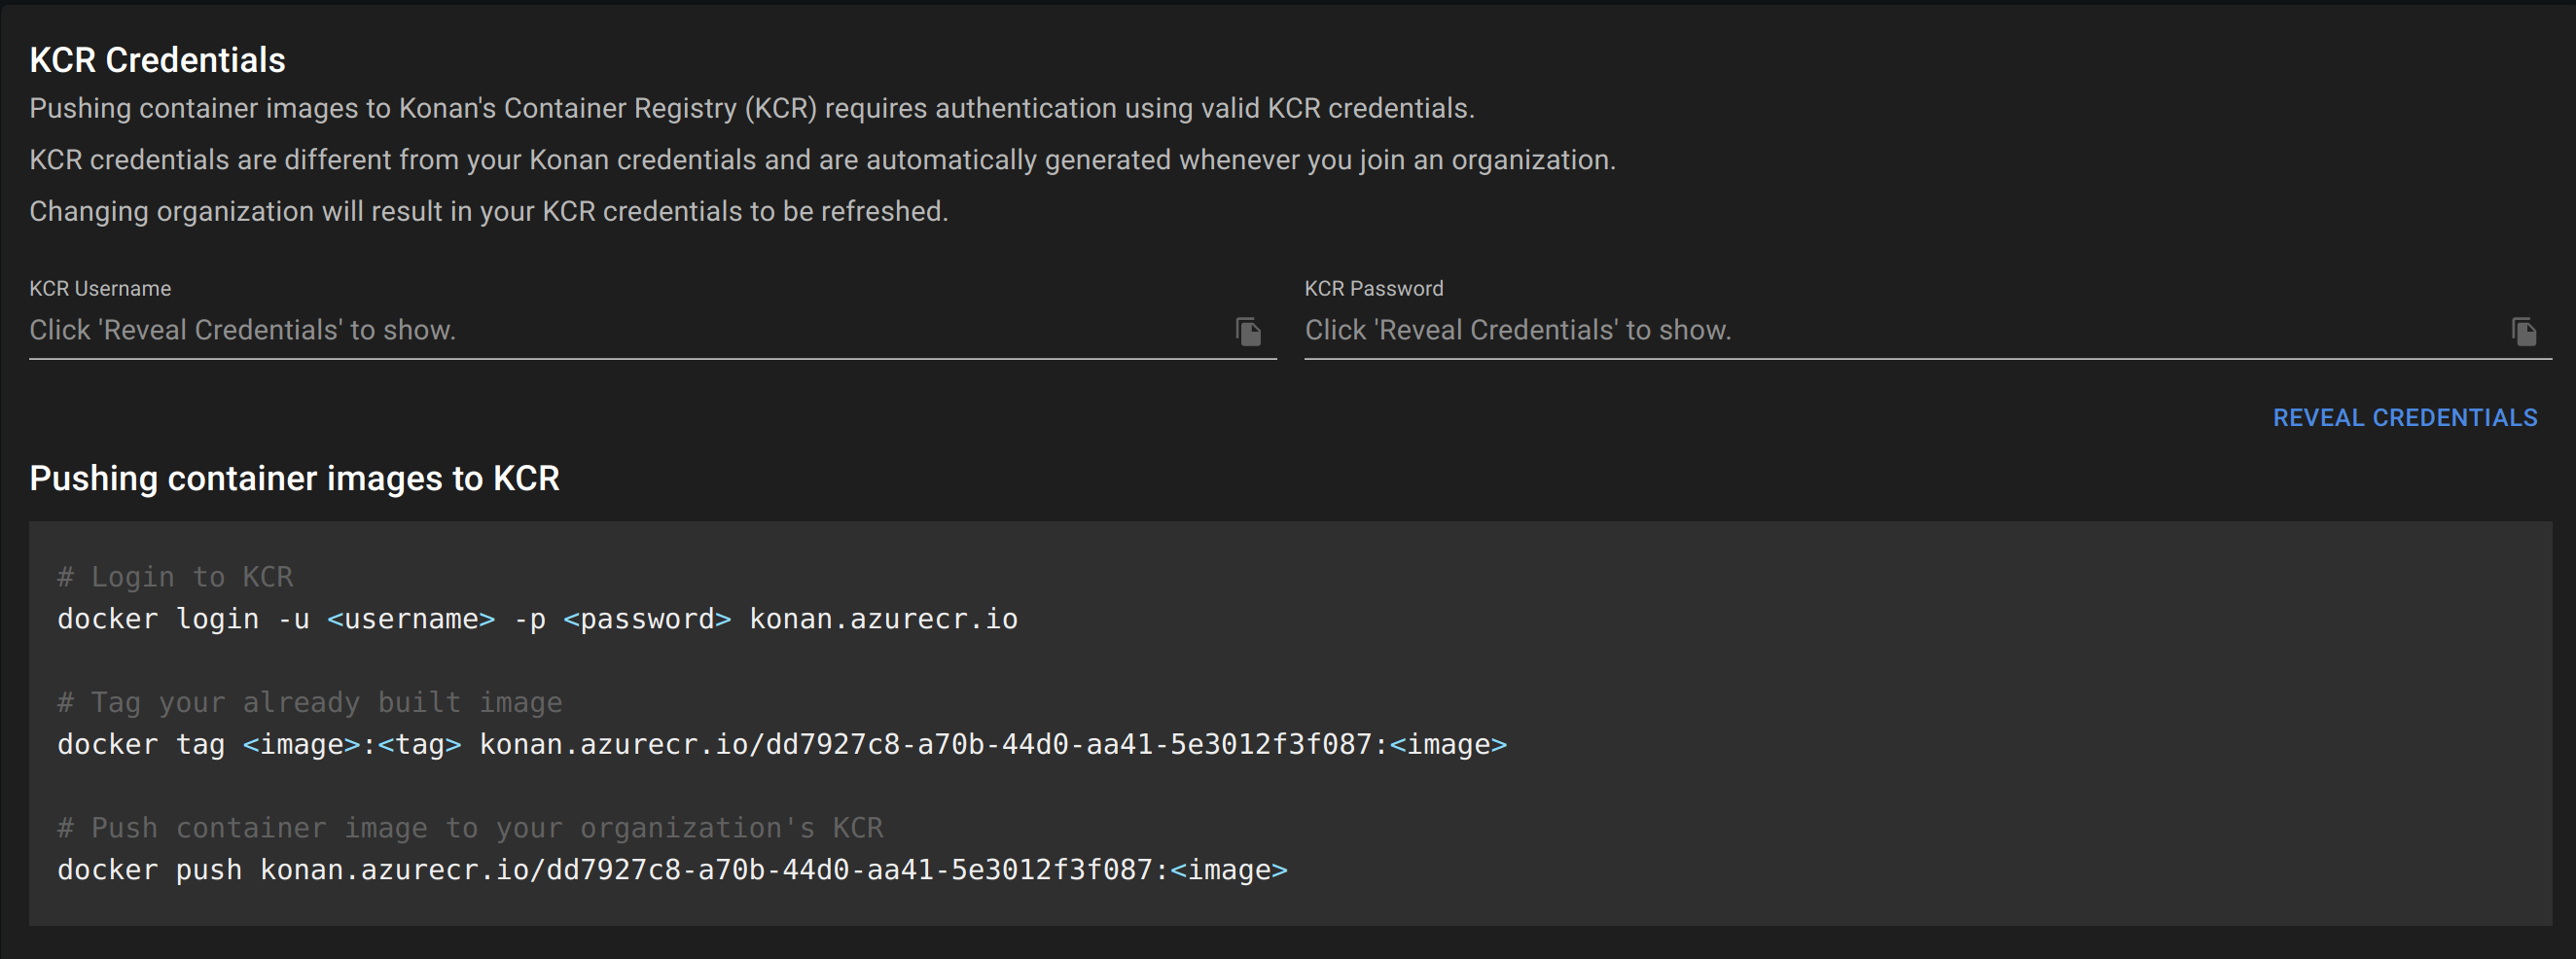
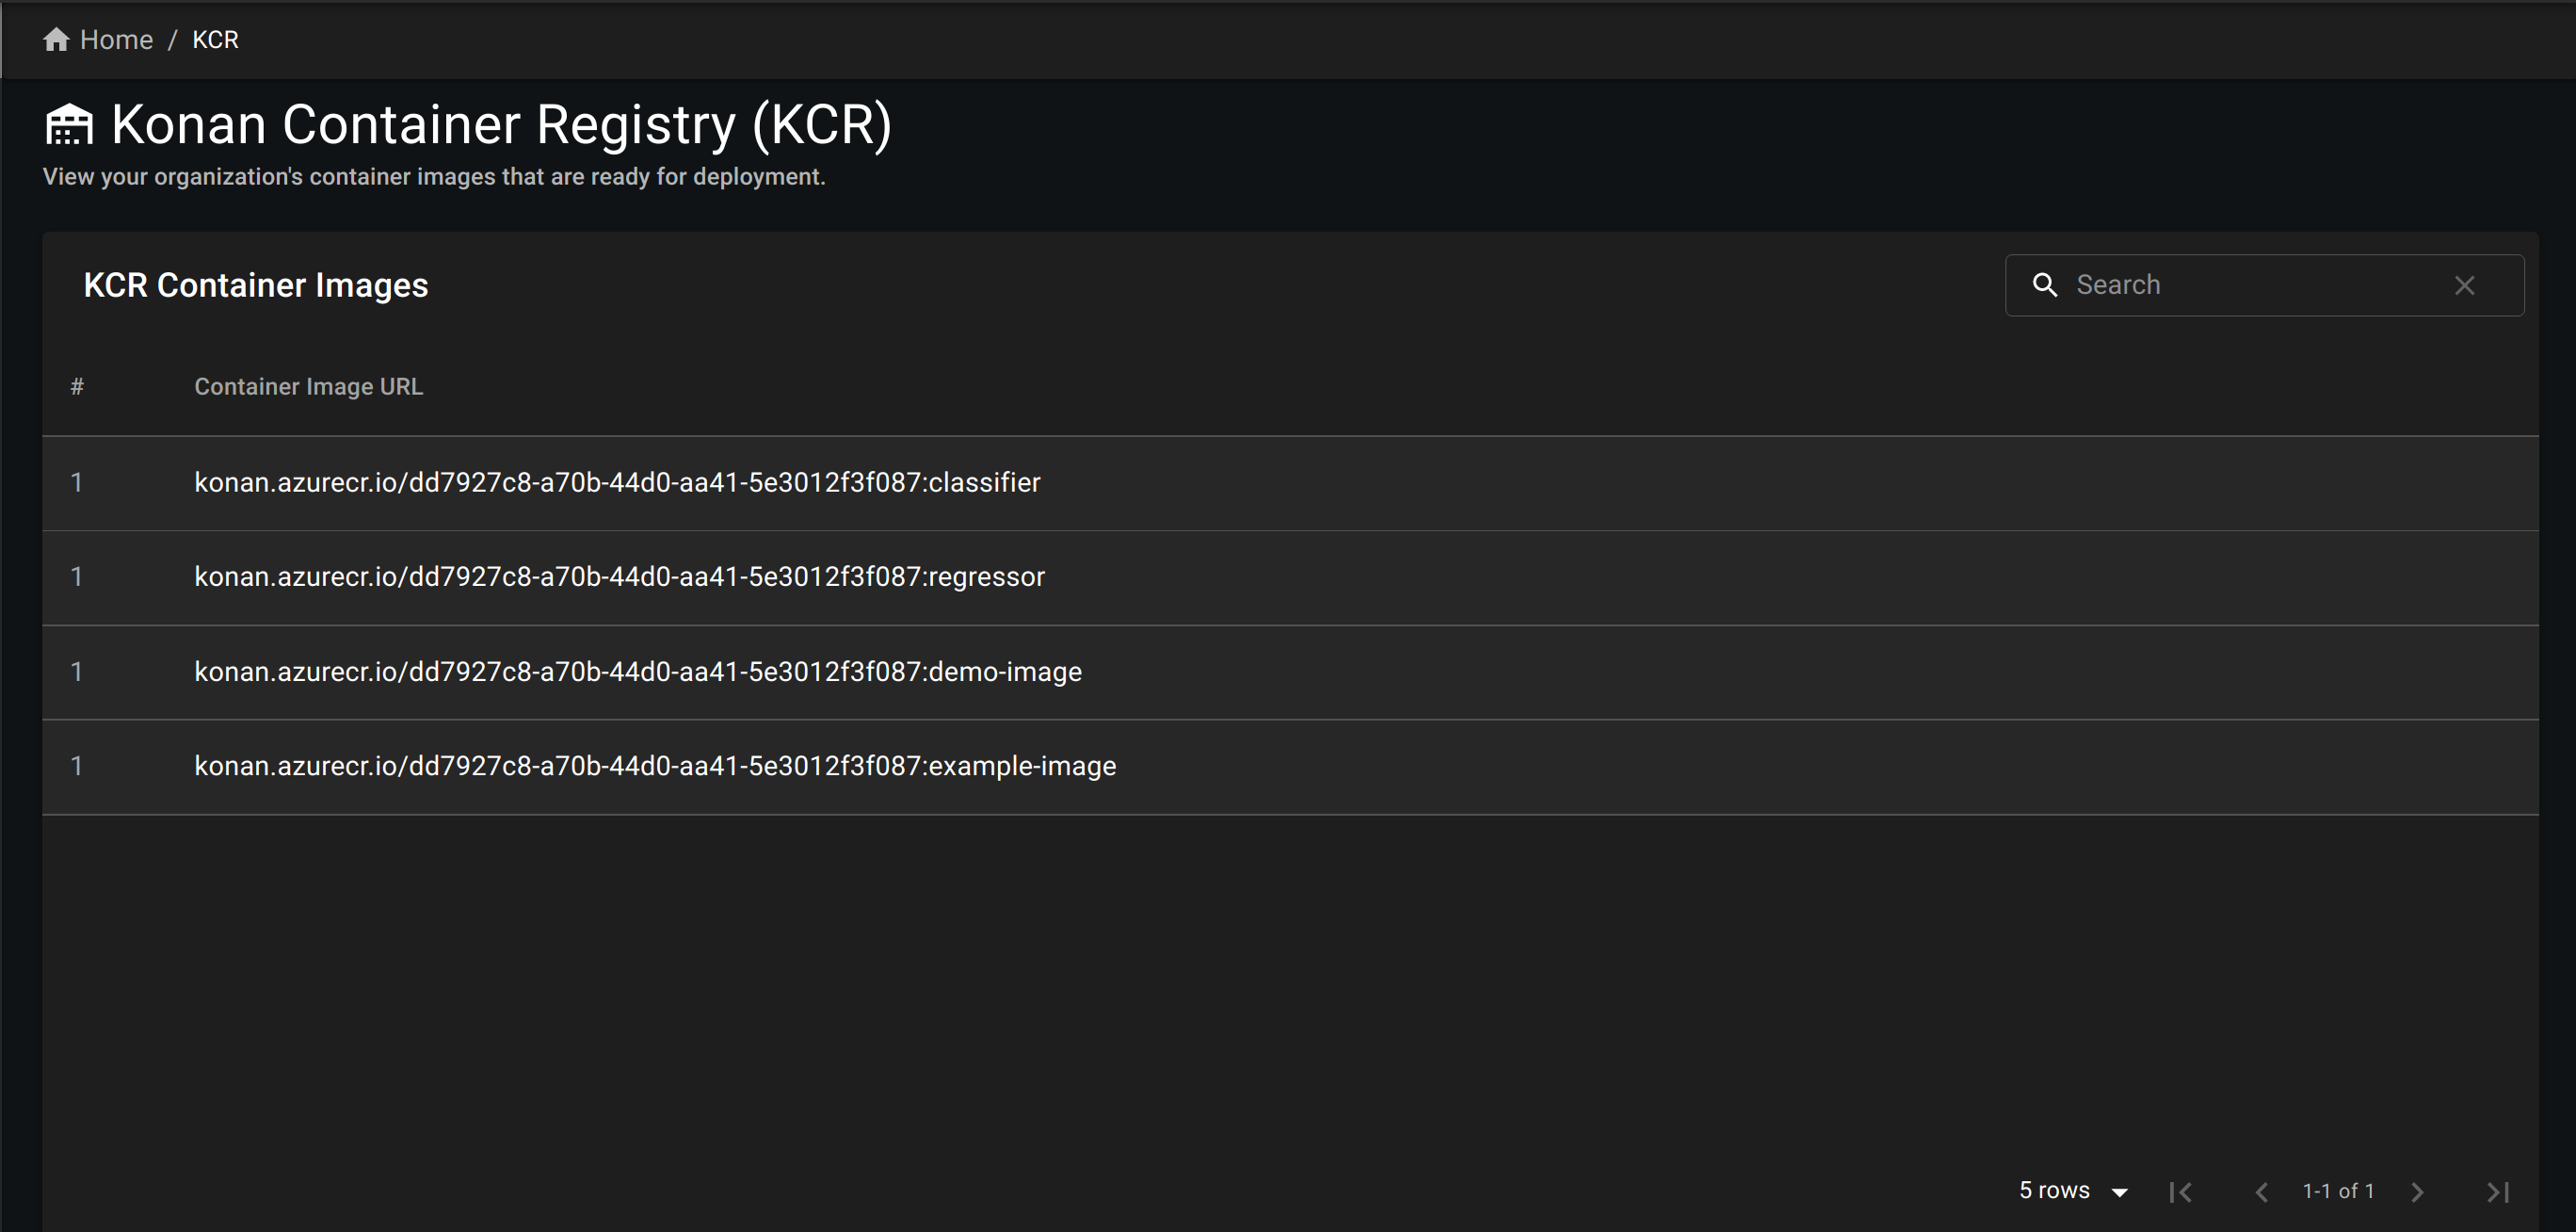
After execute the docker push command, you should see all images pushed by members of your organization under KCR Container Images. You'll be able to browse them while creating a deployment.
Deployments Page
The deployments page is where you can create, view and delete your deployments.
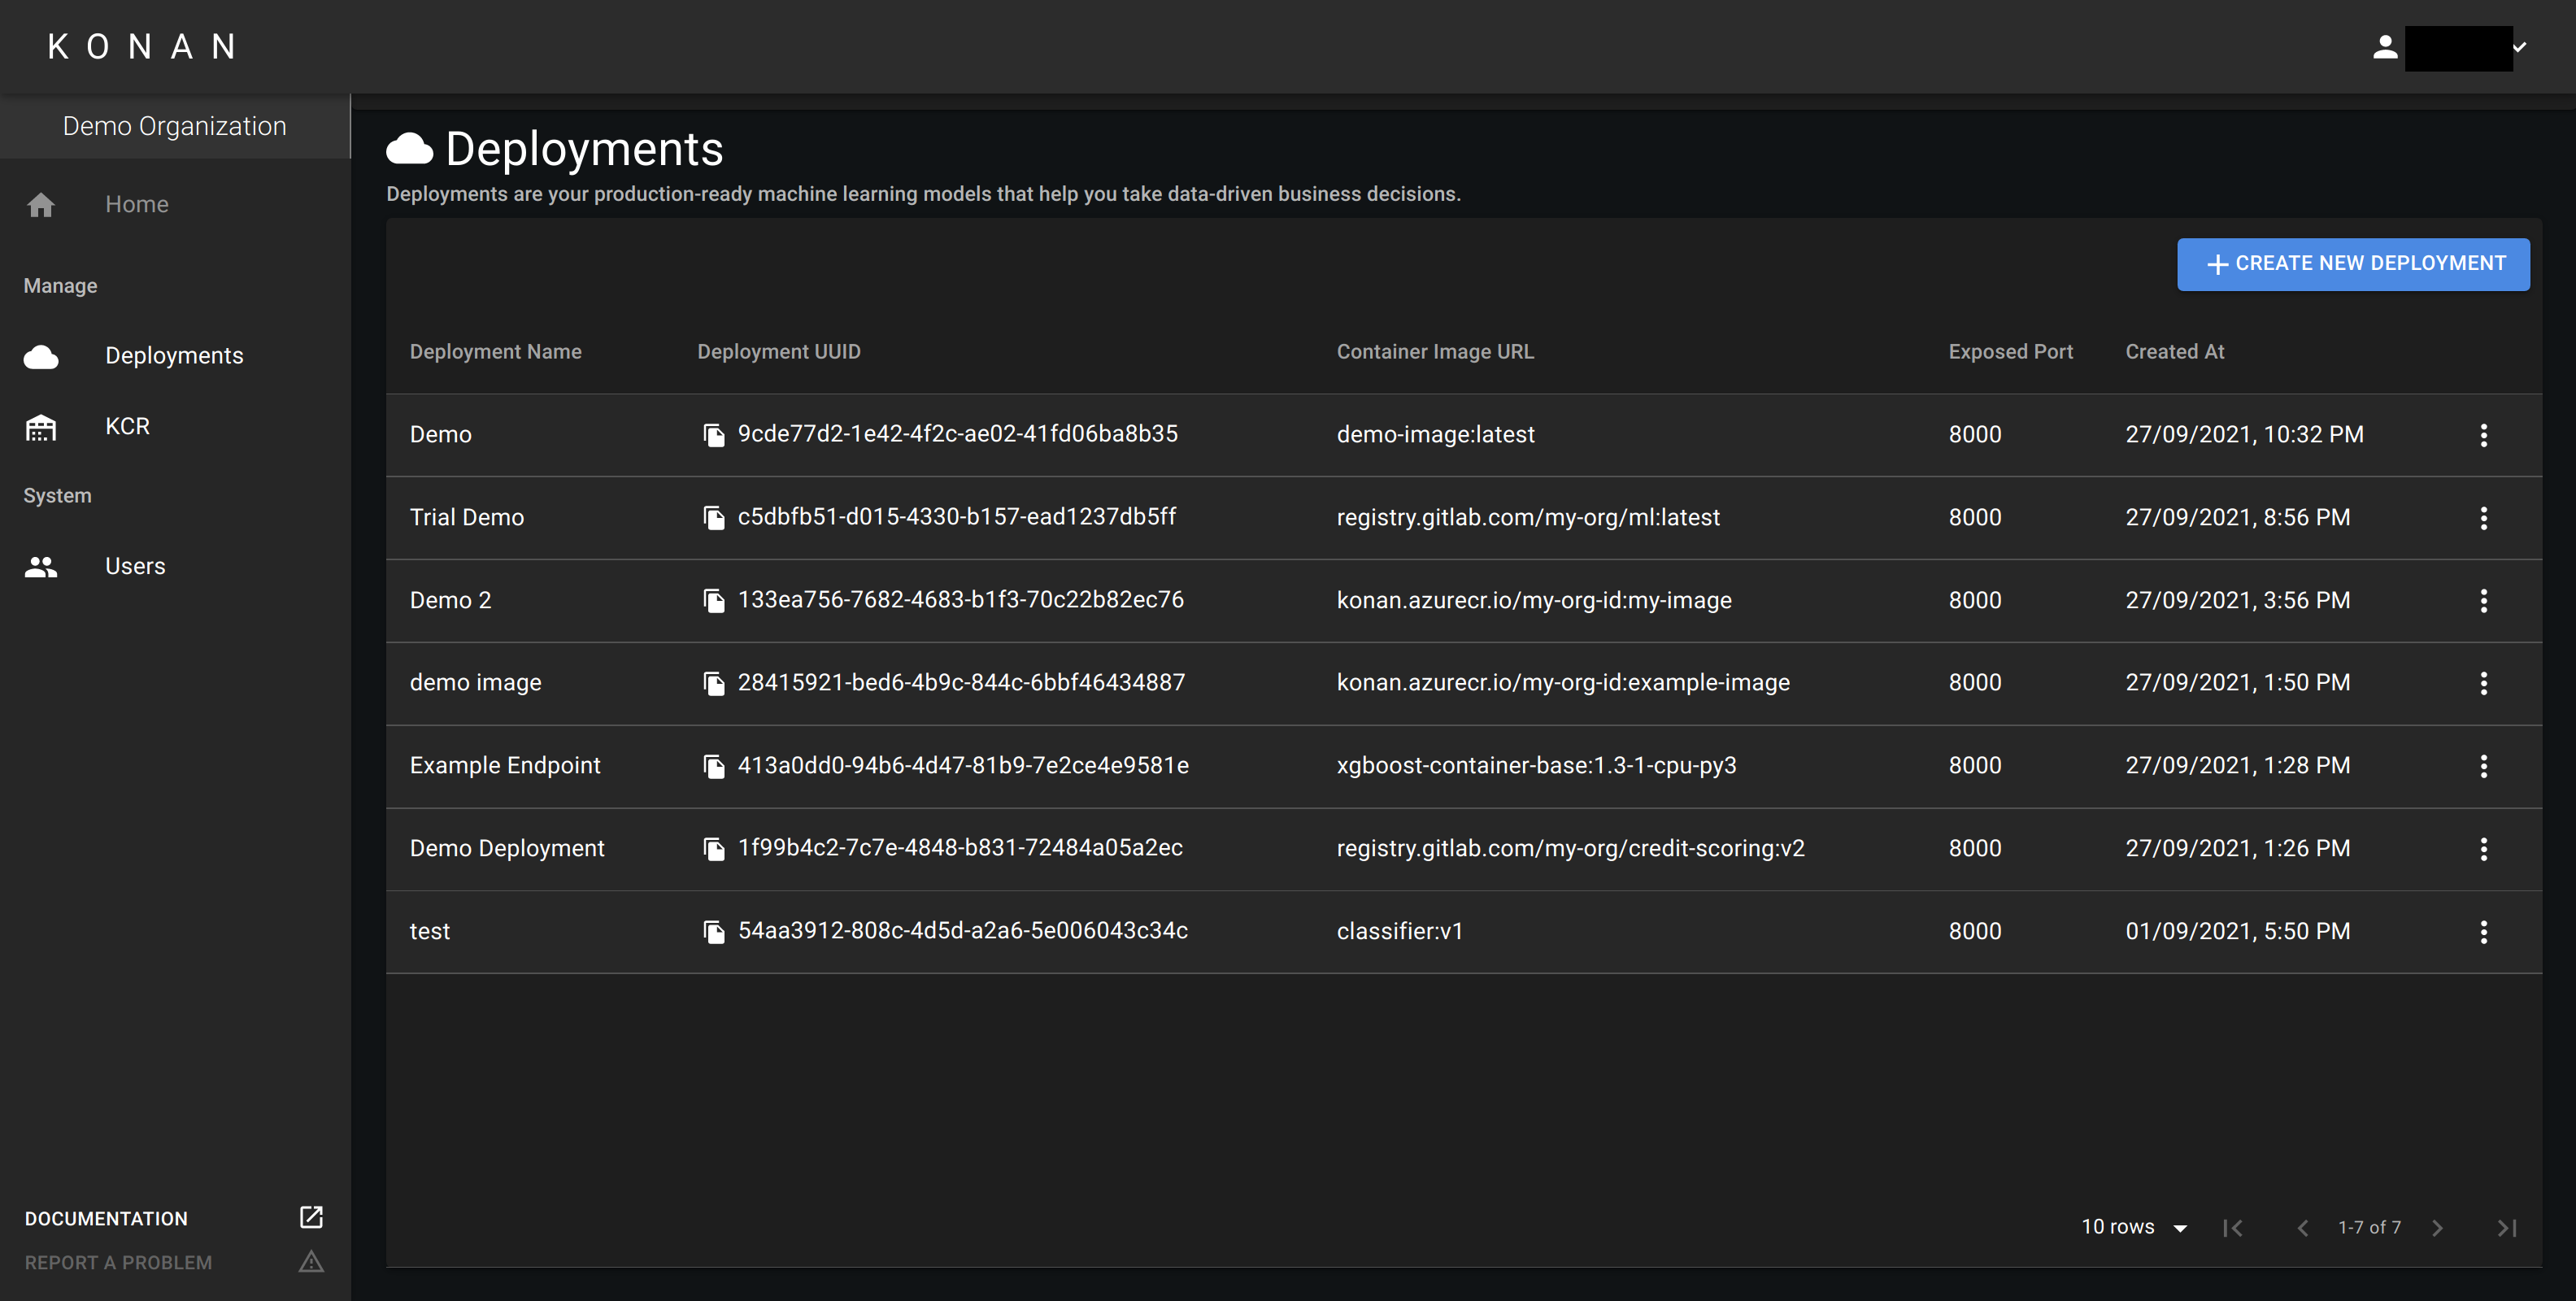
Create Deployment
In the deployments page, create a new deployment. The following dialogue will appear:
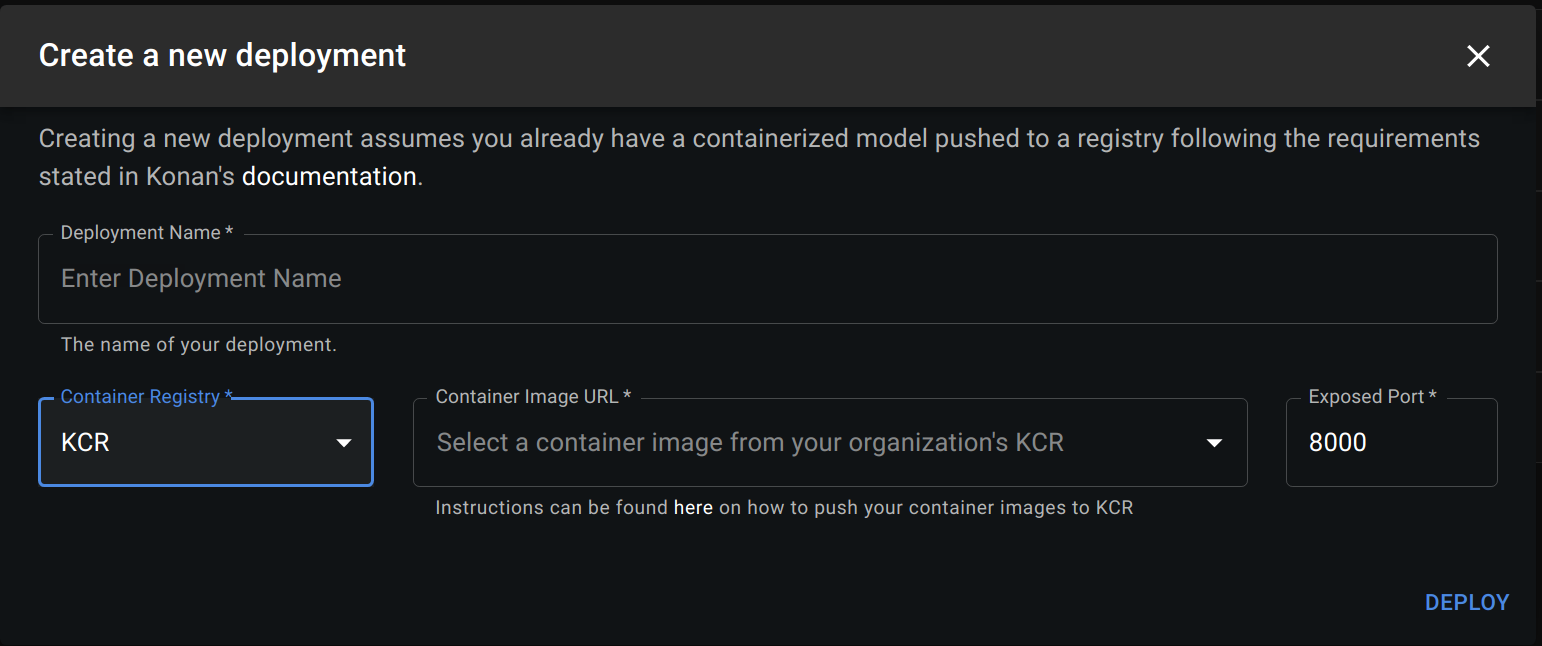
Fill in the following details about your deployment:
- Deployment Name: The name of your deployment.
- Container Registry: Select KCR if you pushed you image there or Custom otherwise.
- Container Image URL:
- If you selected KCR, browse the list of images you pushed and select the one you want to deployed
- If you selected Custom, enter the url of the docker image you created in containerization section. The link should follow this format:
<registry>/<image-name>:<tag>
- Exposed Port: The port Konan should use to communicate with your deployment. This should be the same port exposed in the dockerfile you created here.
- Registry Username: This is only needed if pulling the image requires authentication.
- Registry Password: This is only needed if pulling the image requires authentication.
Deployment Success
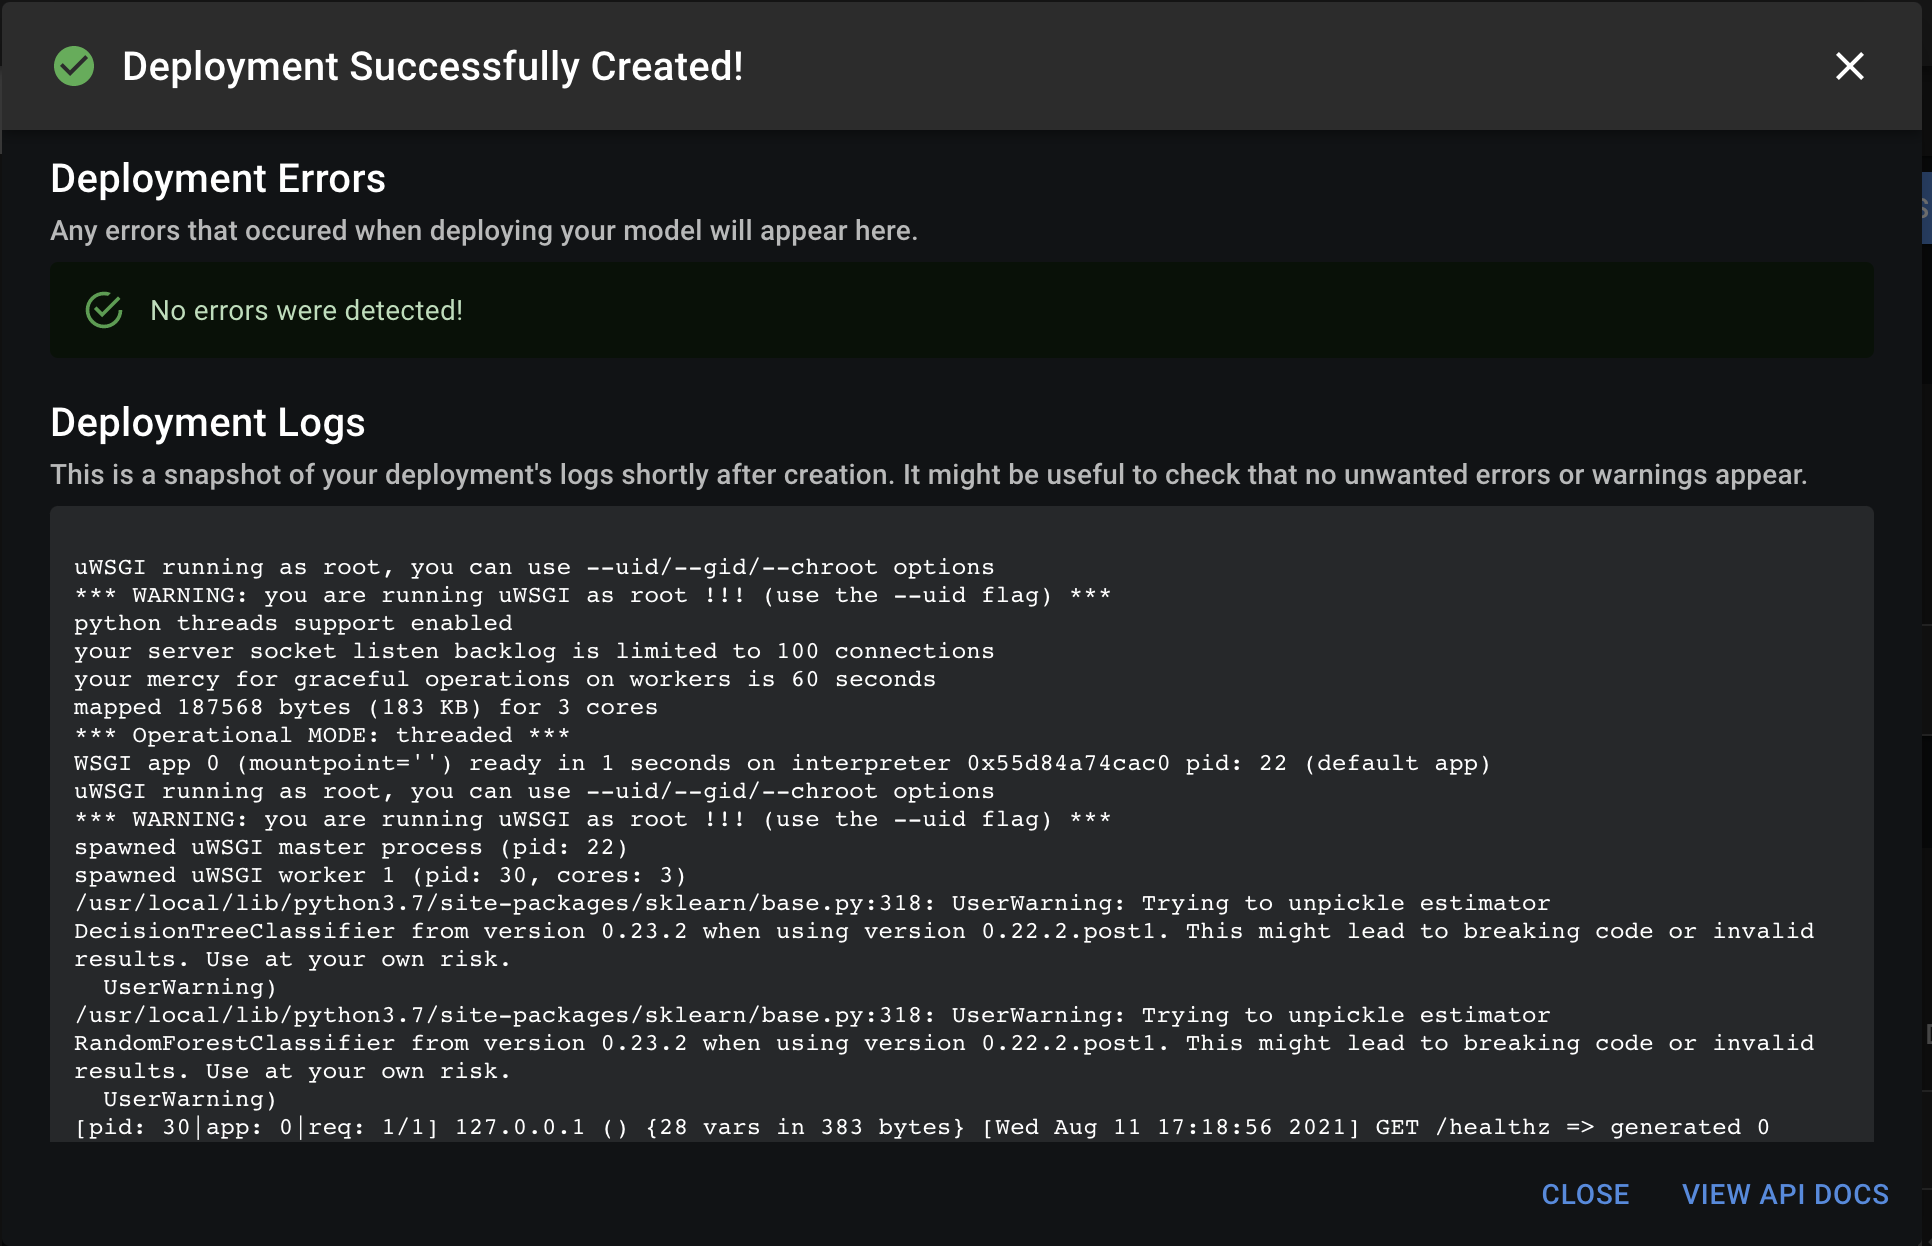
When the deployment succeeds, a dialogue will appear showing a success message and logs. Clicking on View API will take you to the API documentation.
Deployment Failure
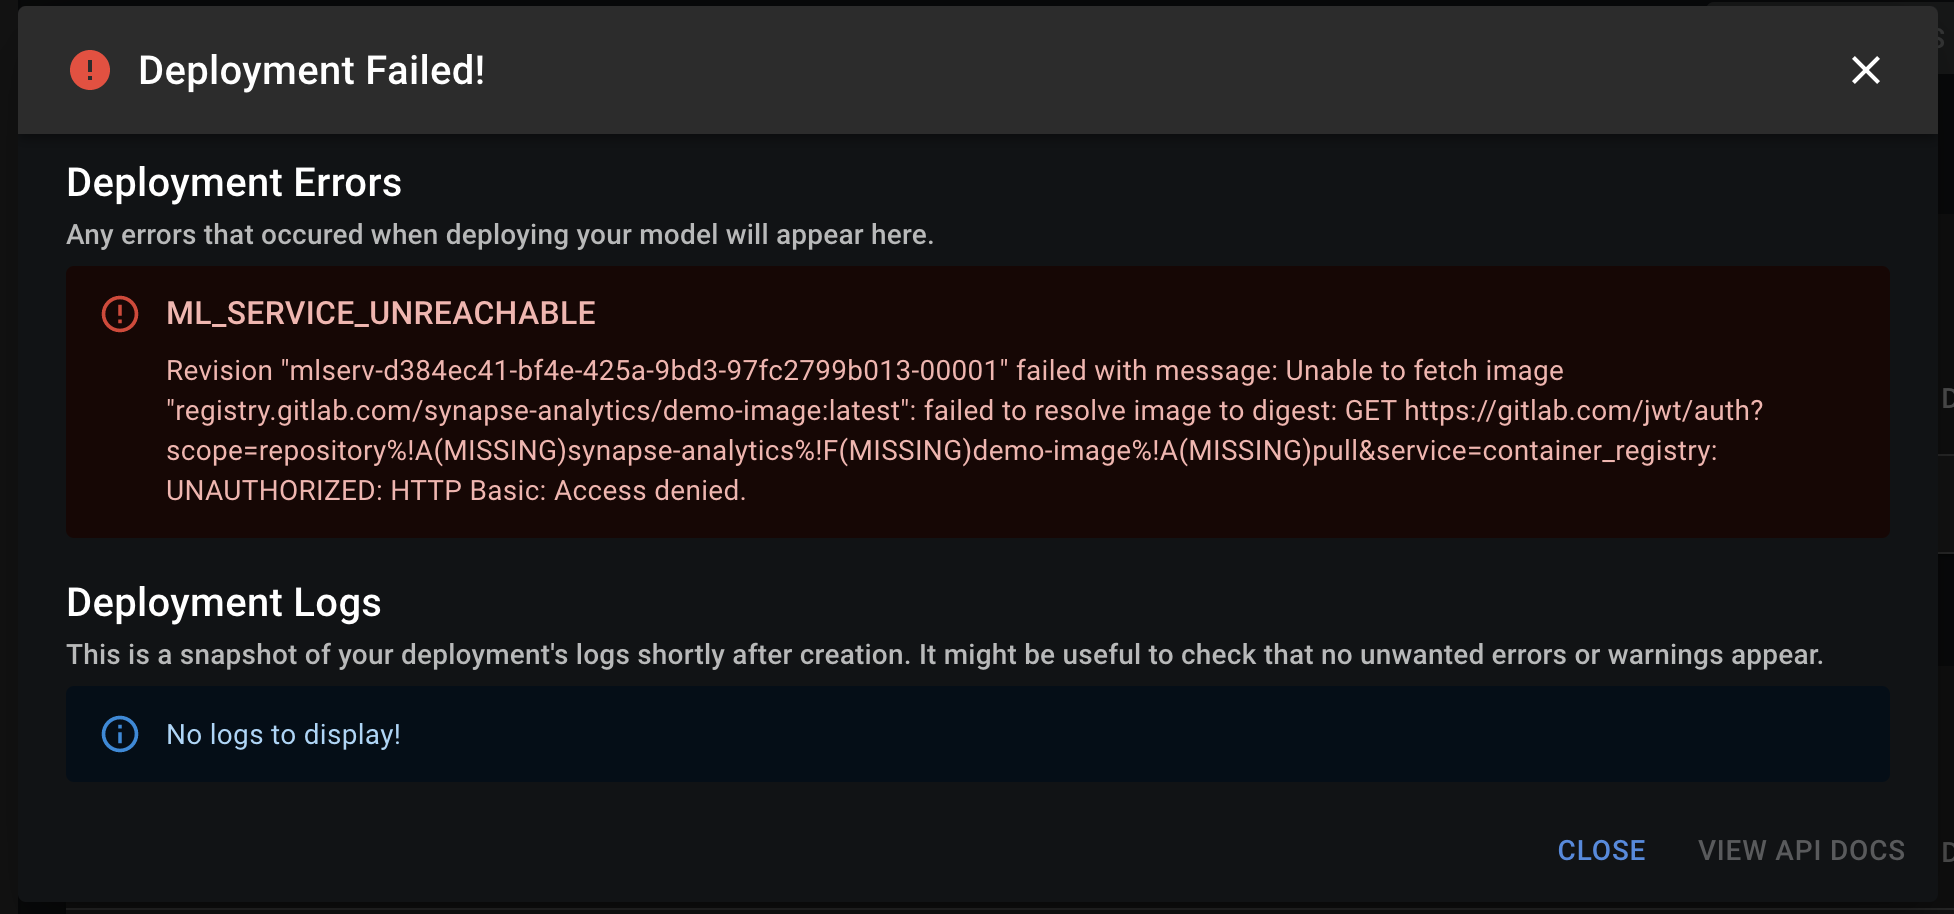
If the deployment fails, a dialogue will appear showing a failure message and logs (if any). Check the message and logs to debug the issue.
Troubleshooting deployment creation error:
If deployment fails, here are a few things you can check:
- Make sure the webserver has a
/healthzas described here. - Make sure the webserver's port is the same as the exposed port set when creating your deployment.
- Make sure the Image URL is valid. You can do so by running
docker pull <image_url>. - If the image url is protected by a username and password, try running
docker login <your_registry>and then runningdocker pull <image_url>. - Check the logs, sometimes the deployment message maybe irrelevant if something within your container is crashing, the logs will help capture that.
If none of the above works, feel free to contact us and we'll help you troubleshooting.
In the current version, the resource limits on a running container for a deployment are 1 CPU and 4G RAM. If your deployment goes over these limits, it will not be able to run on Konan.
In coming versions, users will have control over resource limits according to their needs.
API Monitor
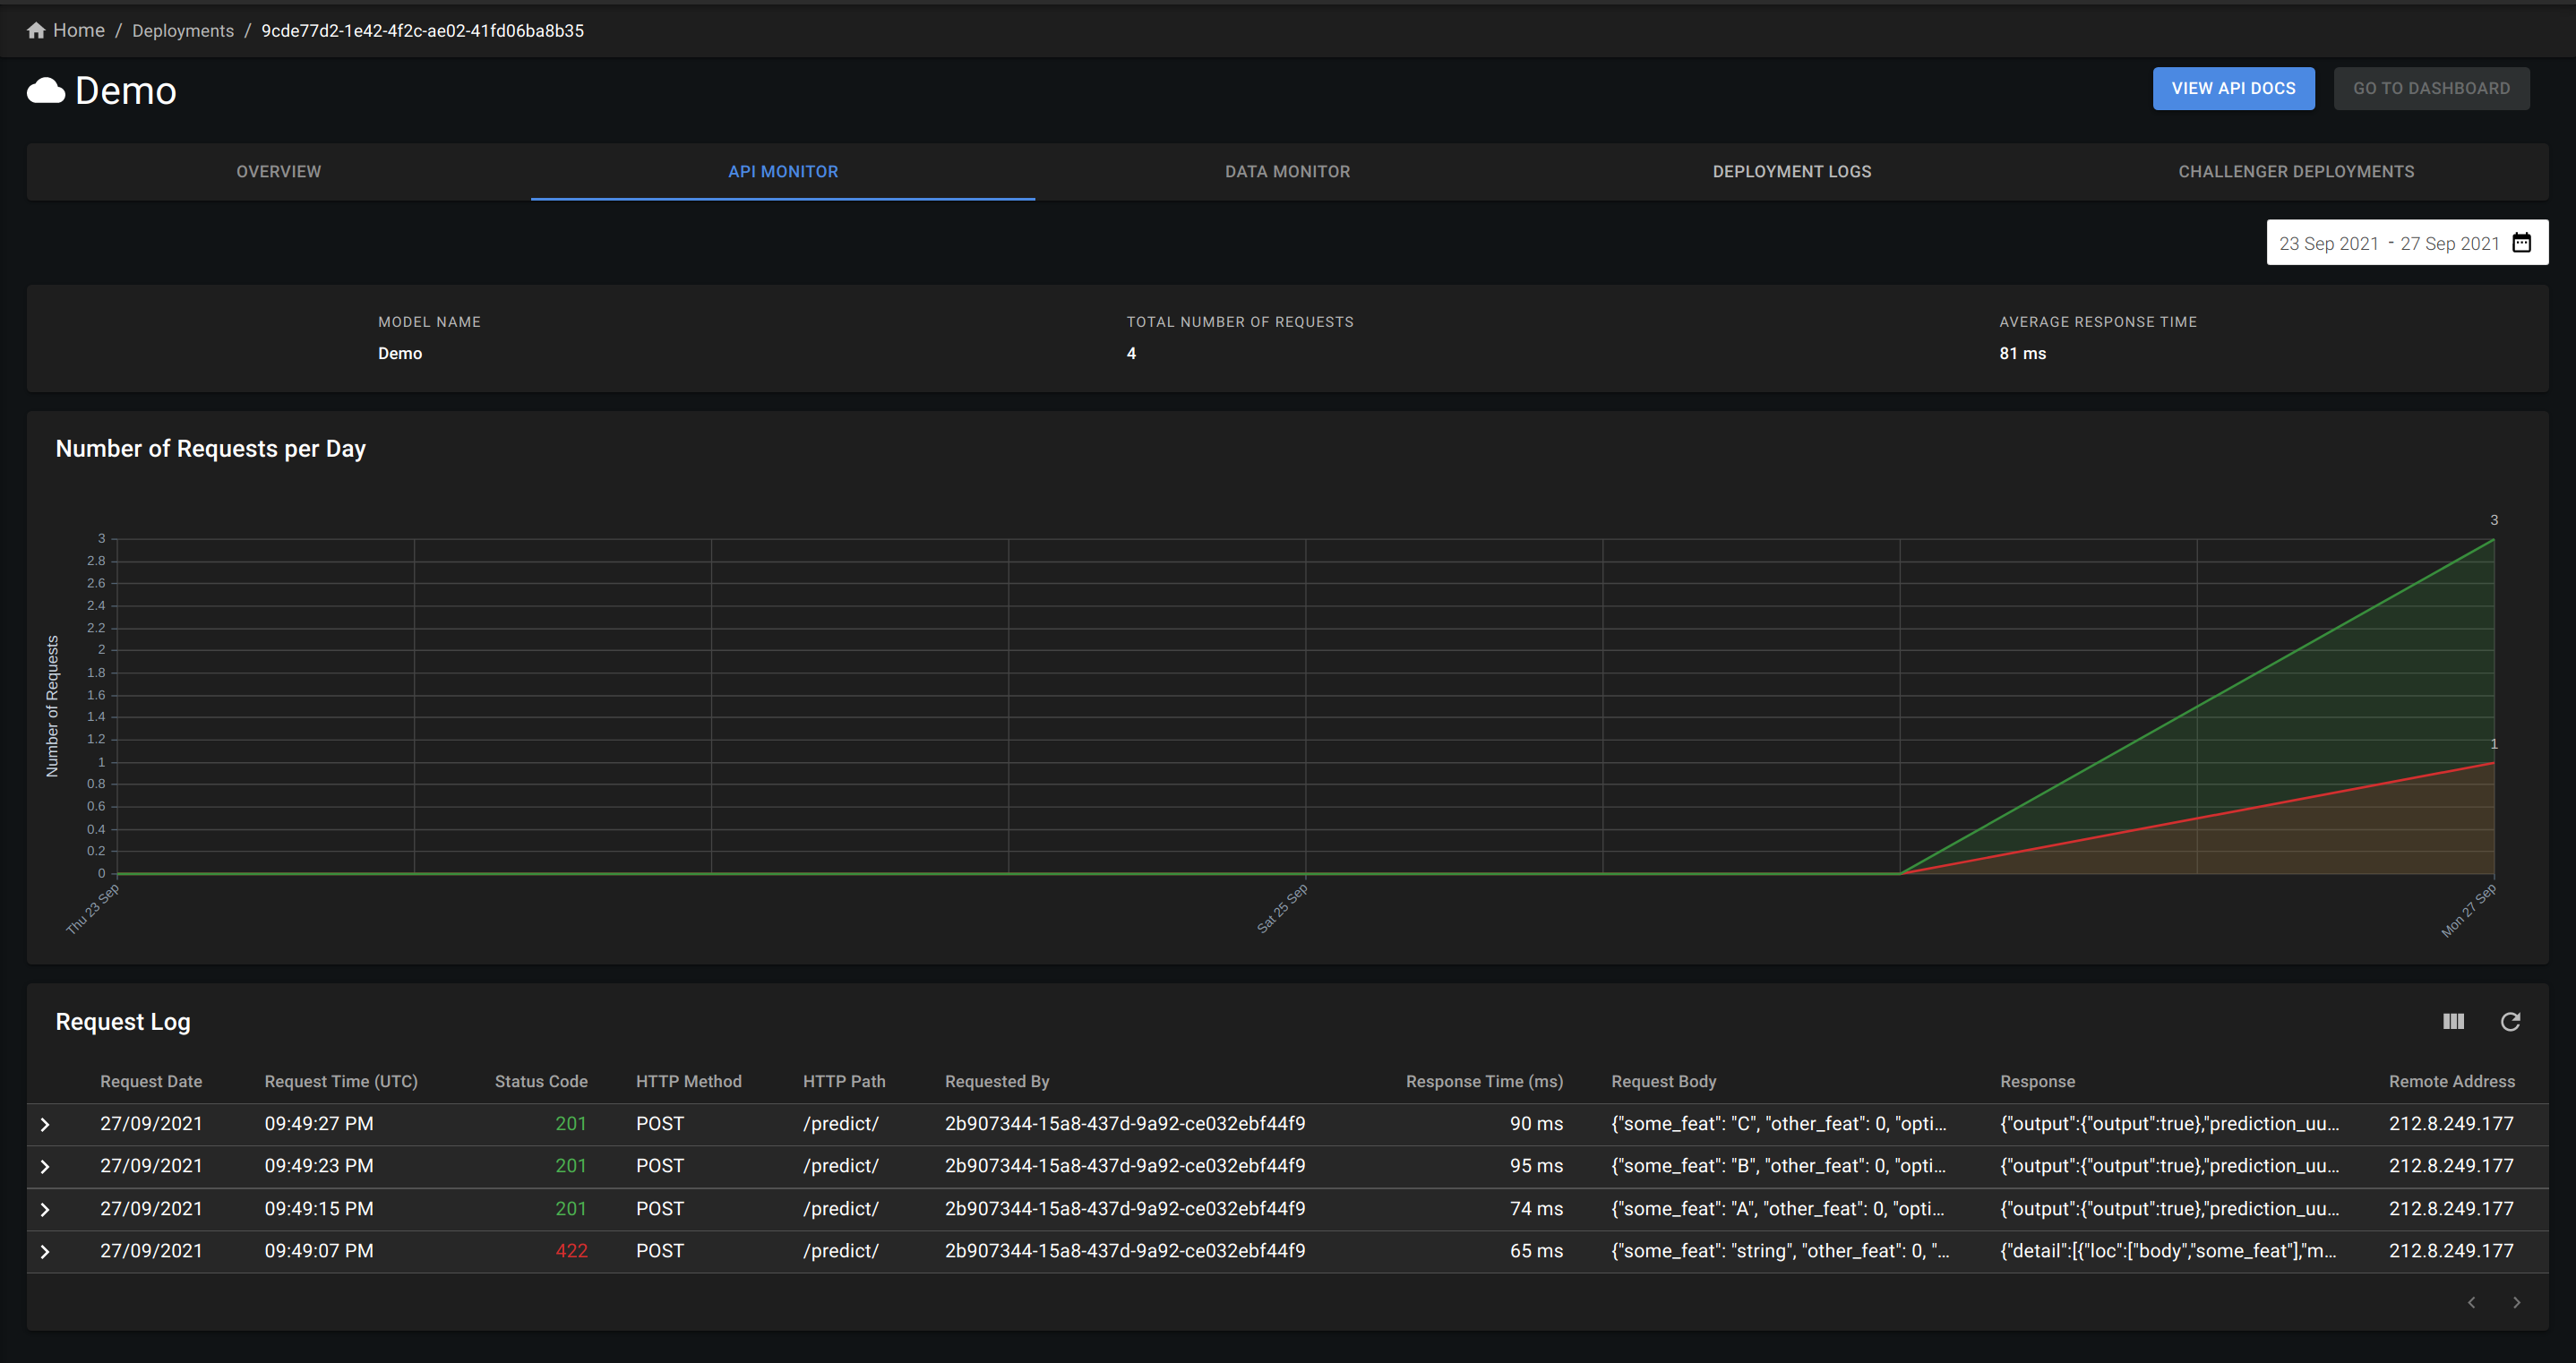
After a successful deployment, you will be able to monitor any incoming requests to your deployment. You can see the details of each request and response including the request body, response status code and response time. You can also see summaries for the daily number of successful and failed requests as well as the average response time.
Deployment Logs
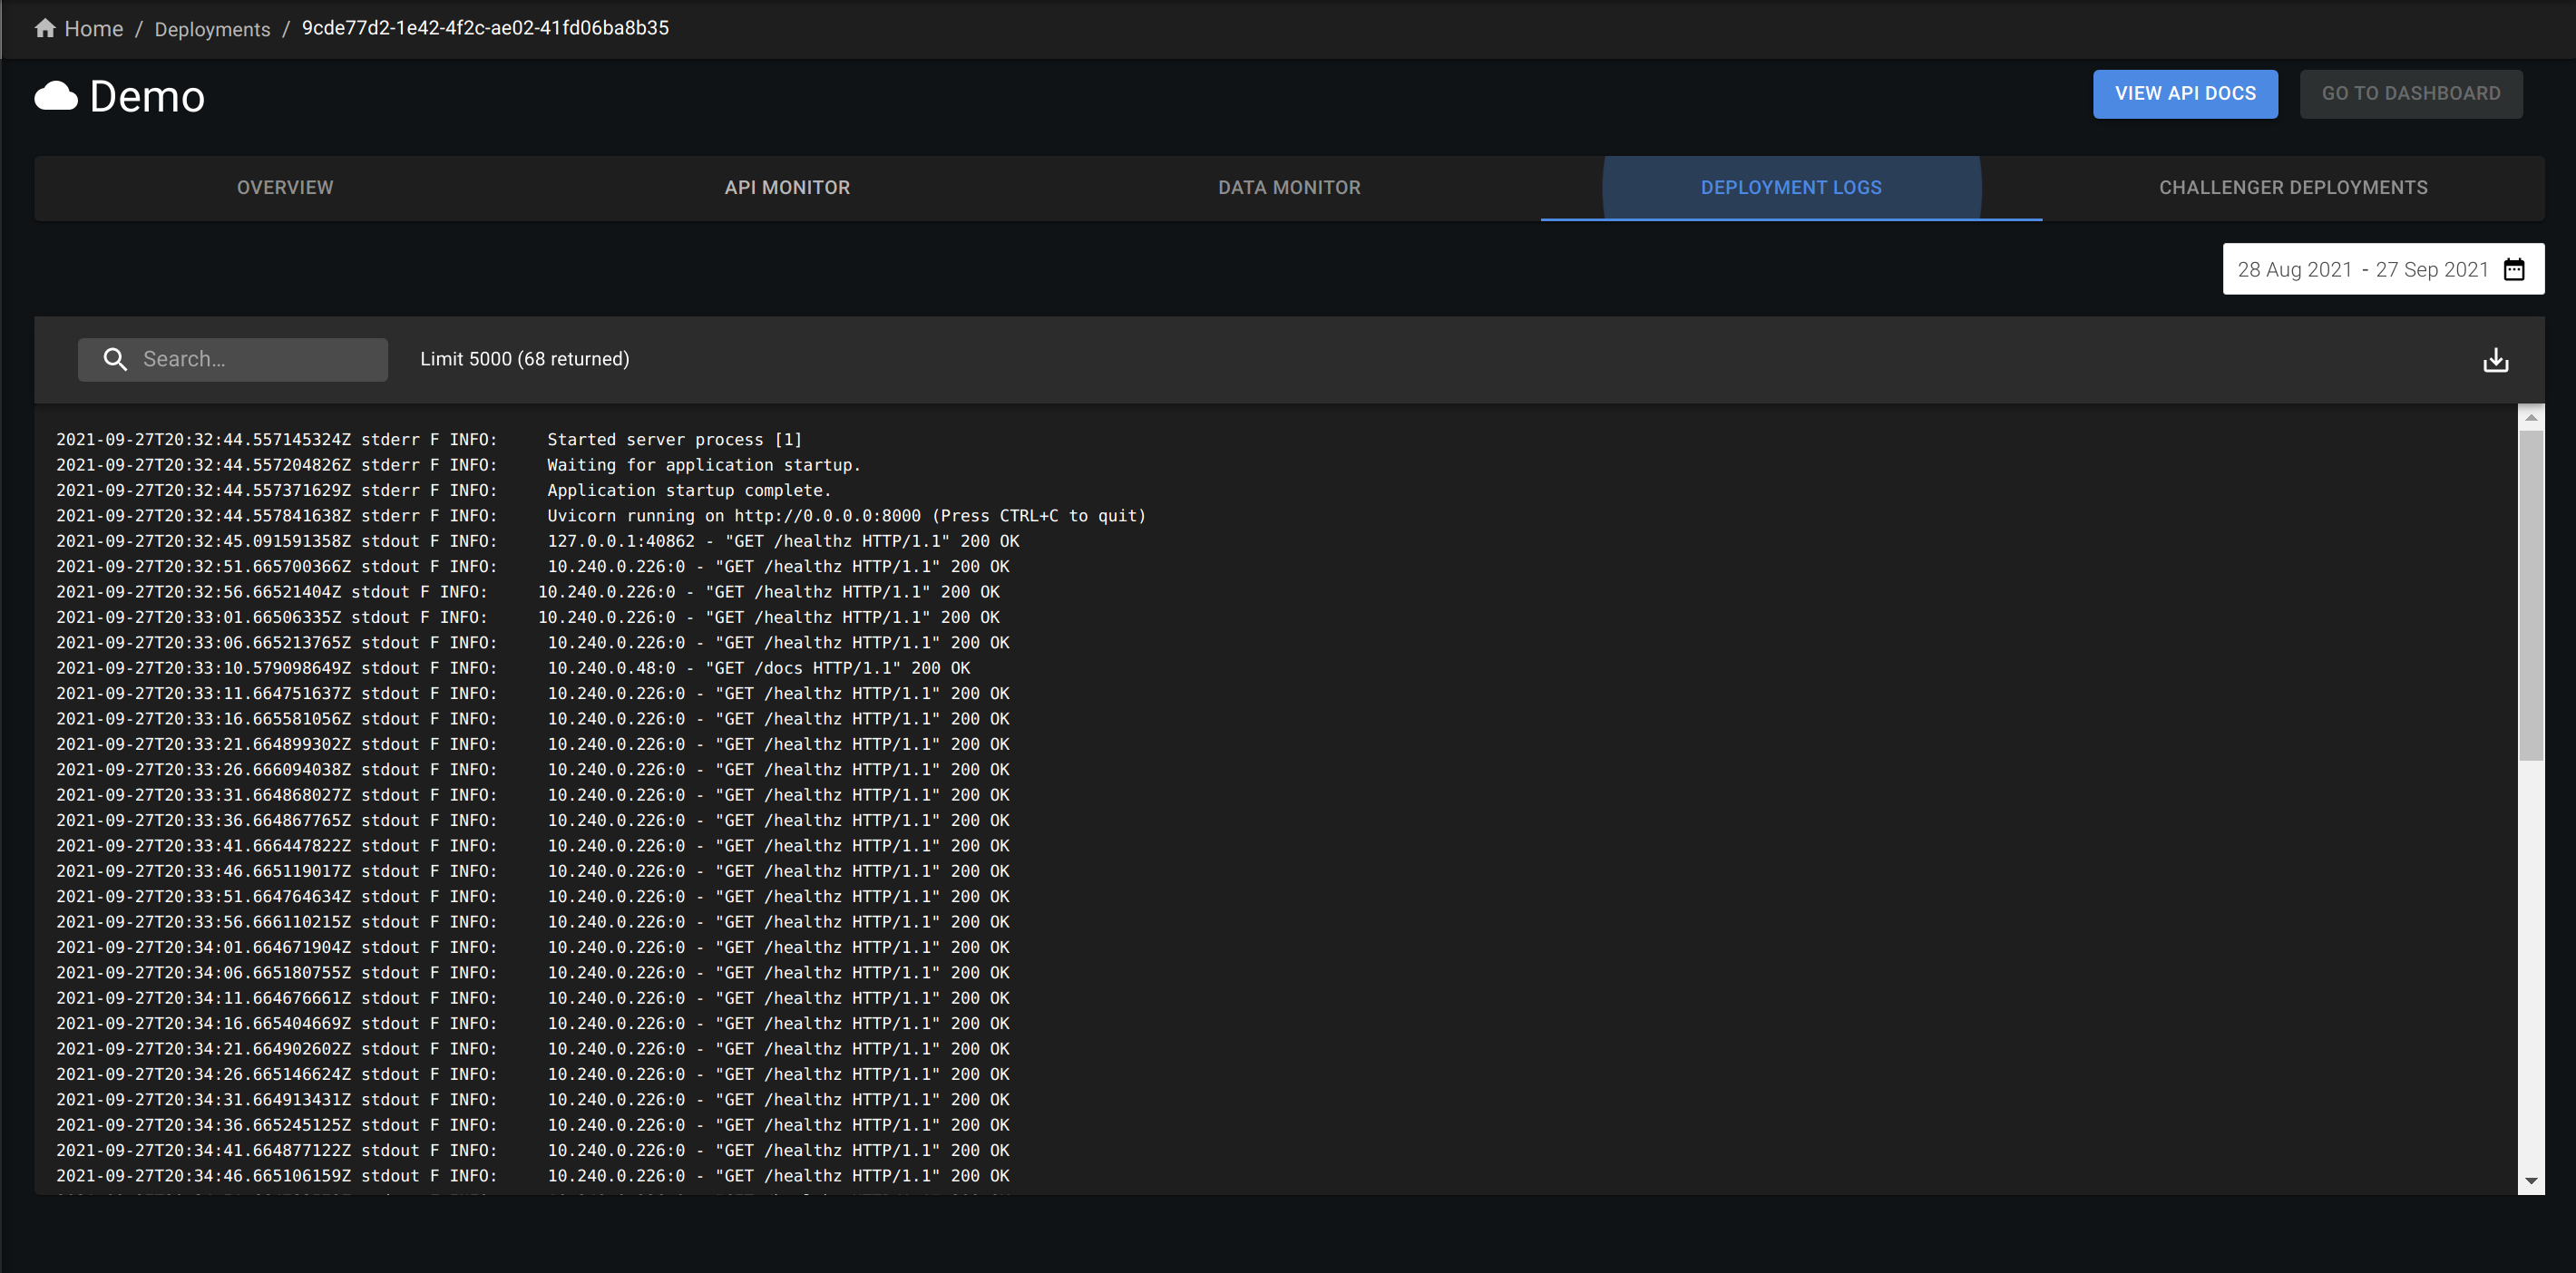
Similar to the logs that appear after deployment, the Deployment Logs tab shows live logs from your deployment. With logging implemented in your deployed application, you'll be able to have full observability on what's going on in your deployment.
There are a couple of things to note:
- If you have log messages on application startup, you may see these messages appear every while in the logs. That is because of the autoscaling that Konan provides. Startup log messages will appear when a new instance of your deployment is spinned up.
- You might see a recurring logs for the
/healthzendpoint. You may ignore them; Konan uses this endpoint internally to check your deployments are healthy.
API Documentation
Each deployment has its API document, which is used to communicate how to use and integrate with the API by defining the expected inputs and outputs. Click the "View API Docs" button in the top right corner of the deployment details page.
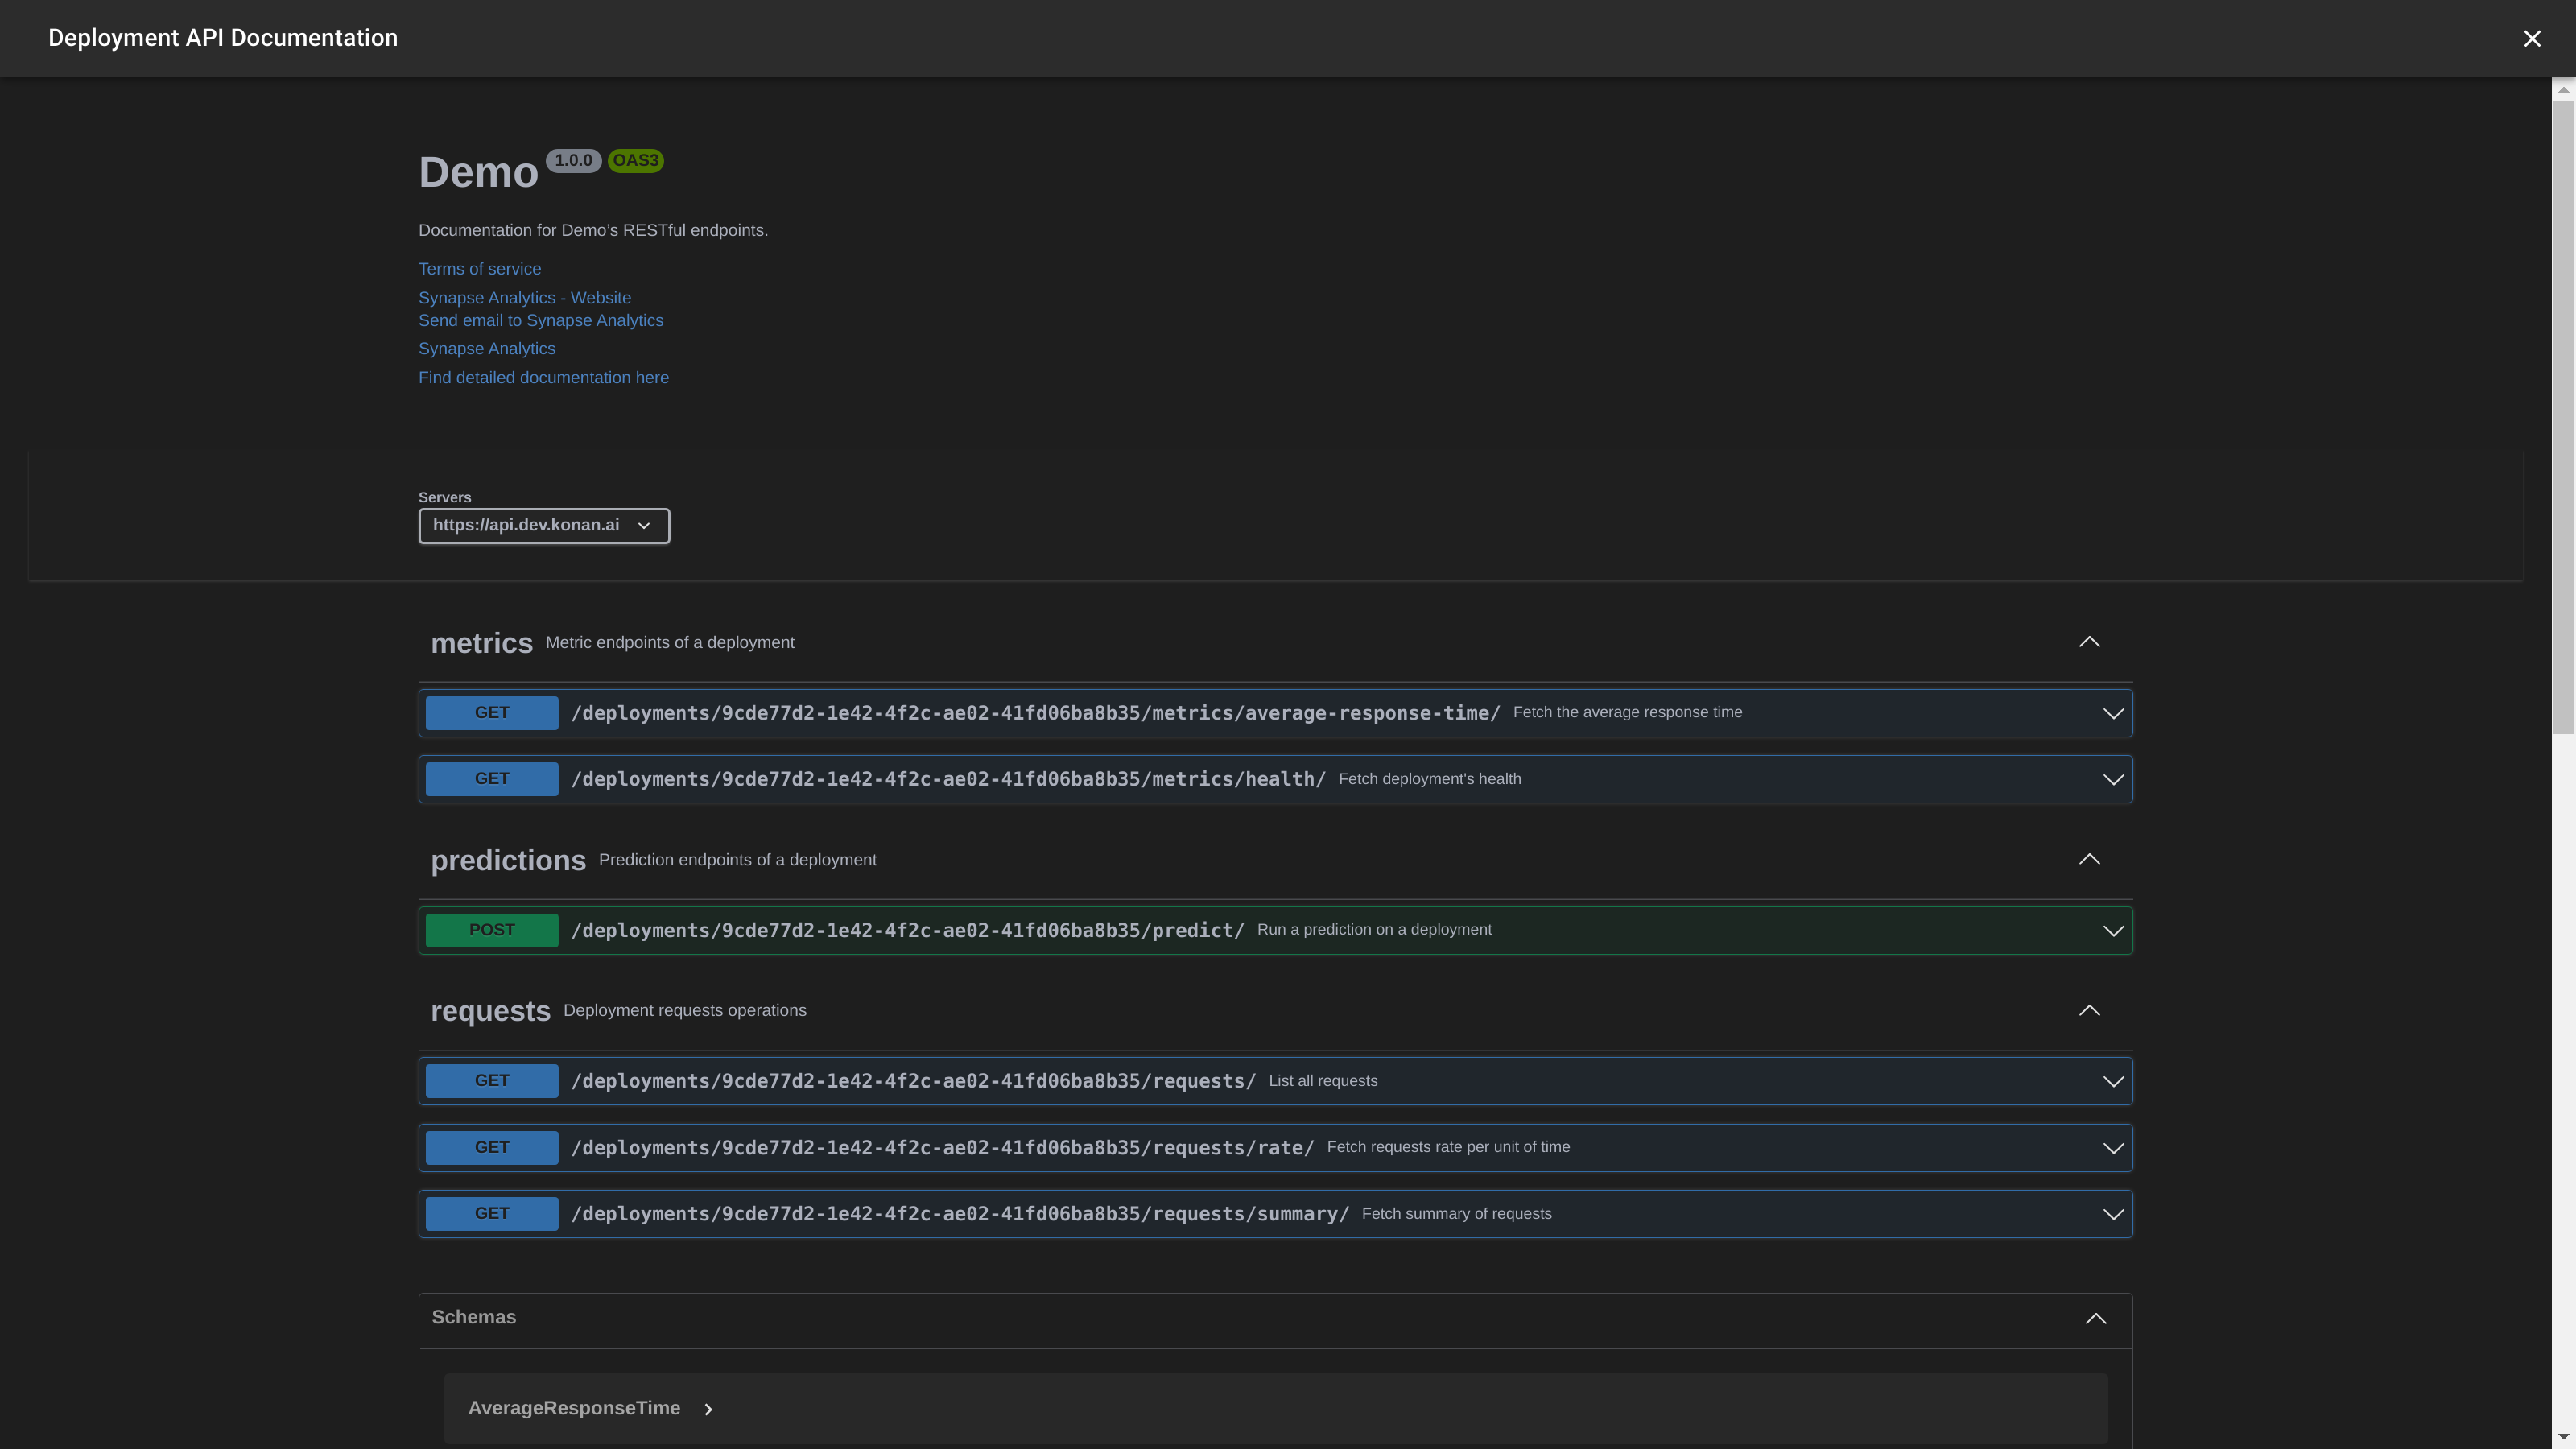
The API docs are interactive, so you can try sending requests from there.
Any requests tried through the view API docs will reflect in the deployments' request logs.
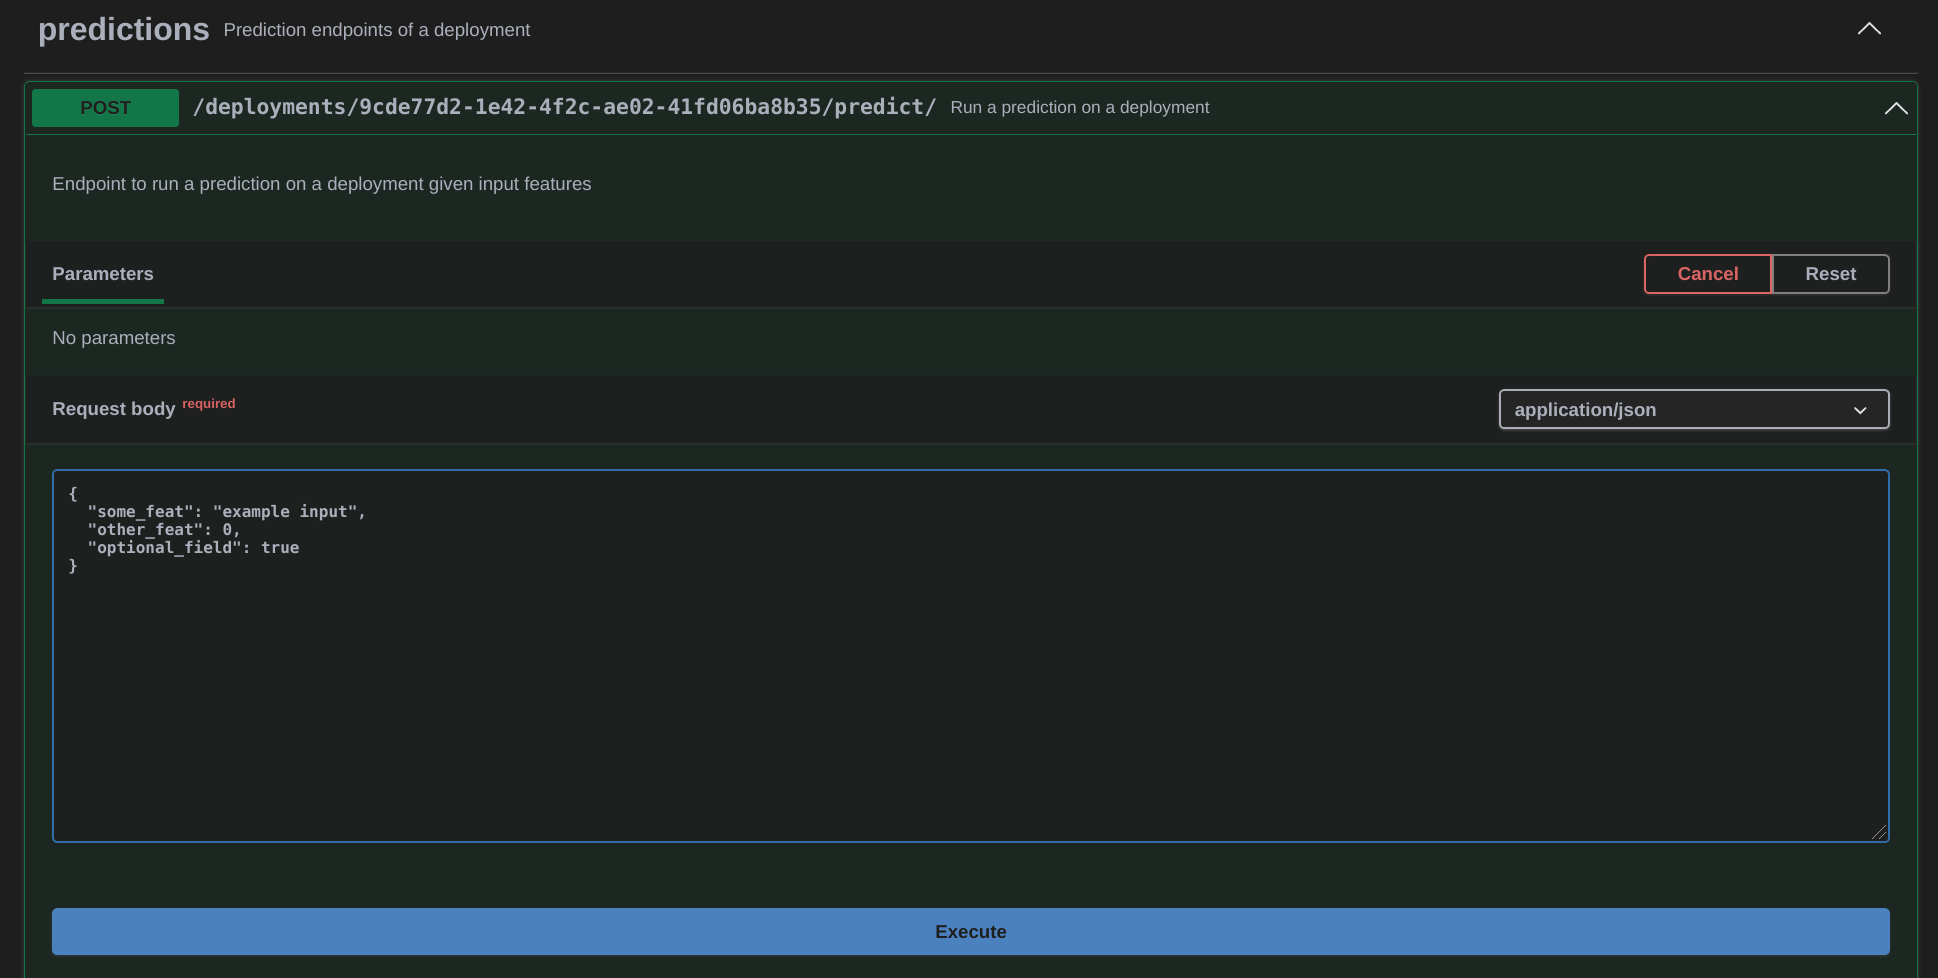
To try out the endpoint, press the "Try it out" button at the top right. You should now see a window where you can insert the input that you want to send to your deployment. Insert your input then "Execute" to send the request.
If you sent a valid input, you should get your deployment's output as shown in the following image
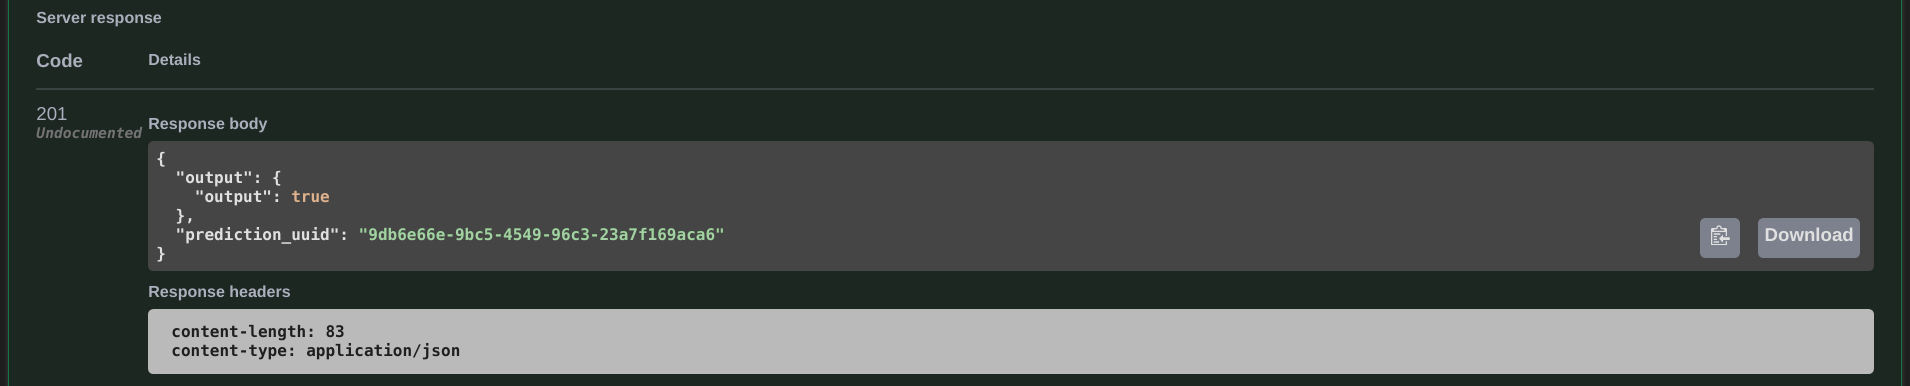
Congratulations!! You've just deployed your first model on Konan!!
Head over to API Integration - Python to see how you can integrate with your deployments (or API Integration - Other Languages if you're using something other than python).